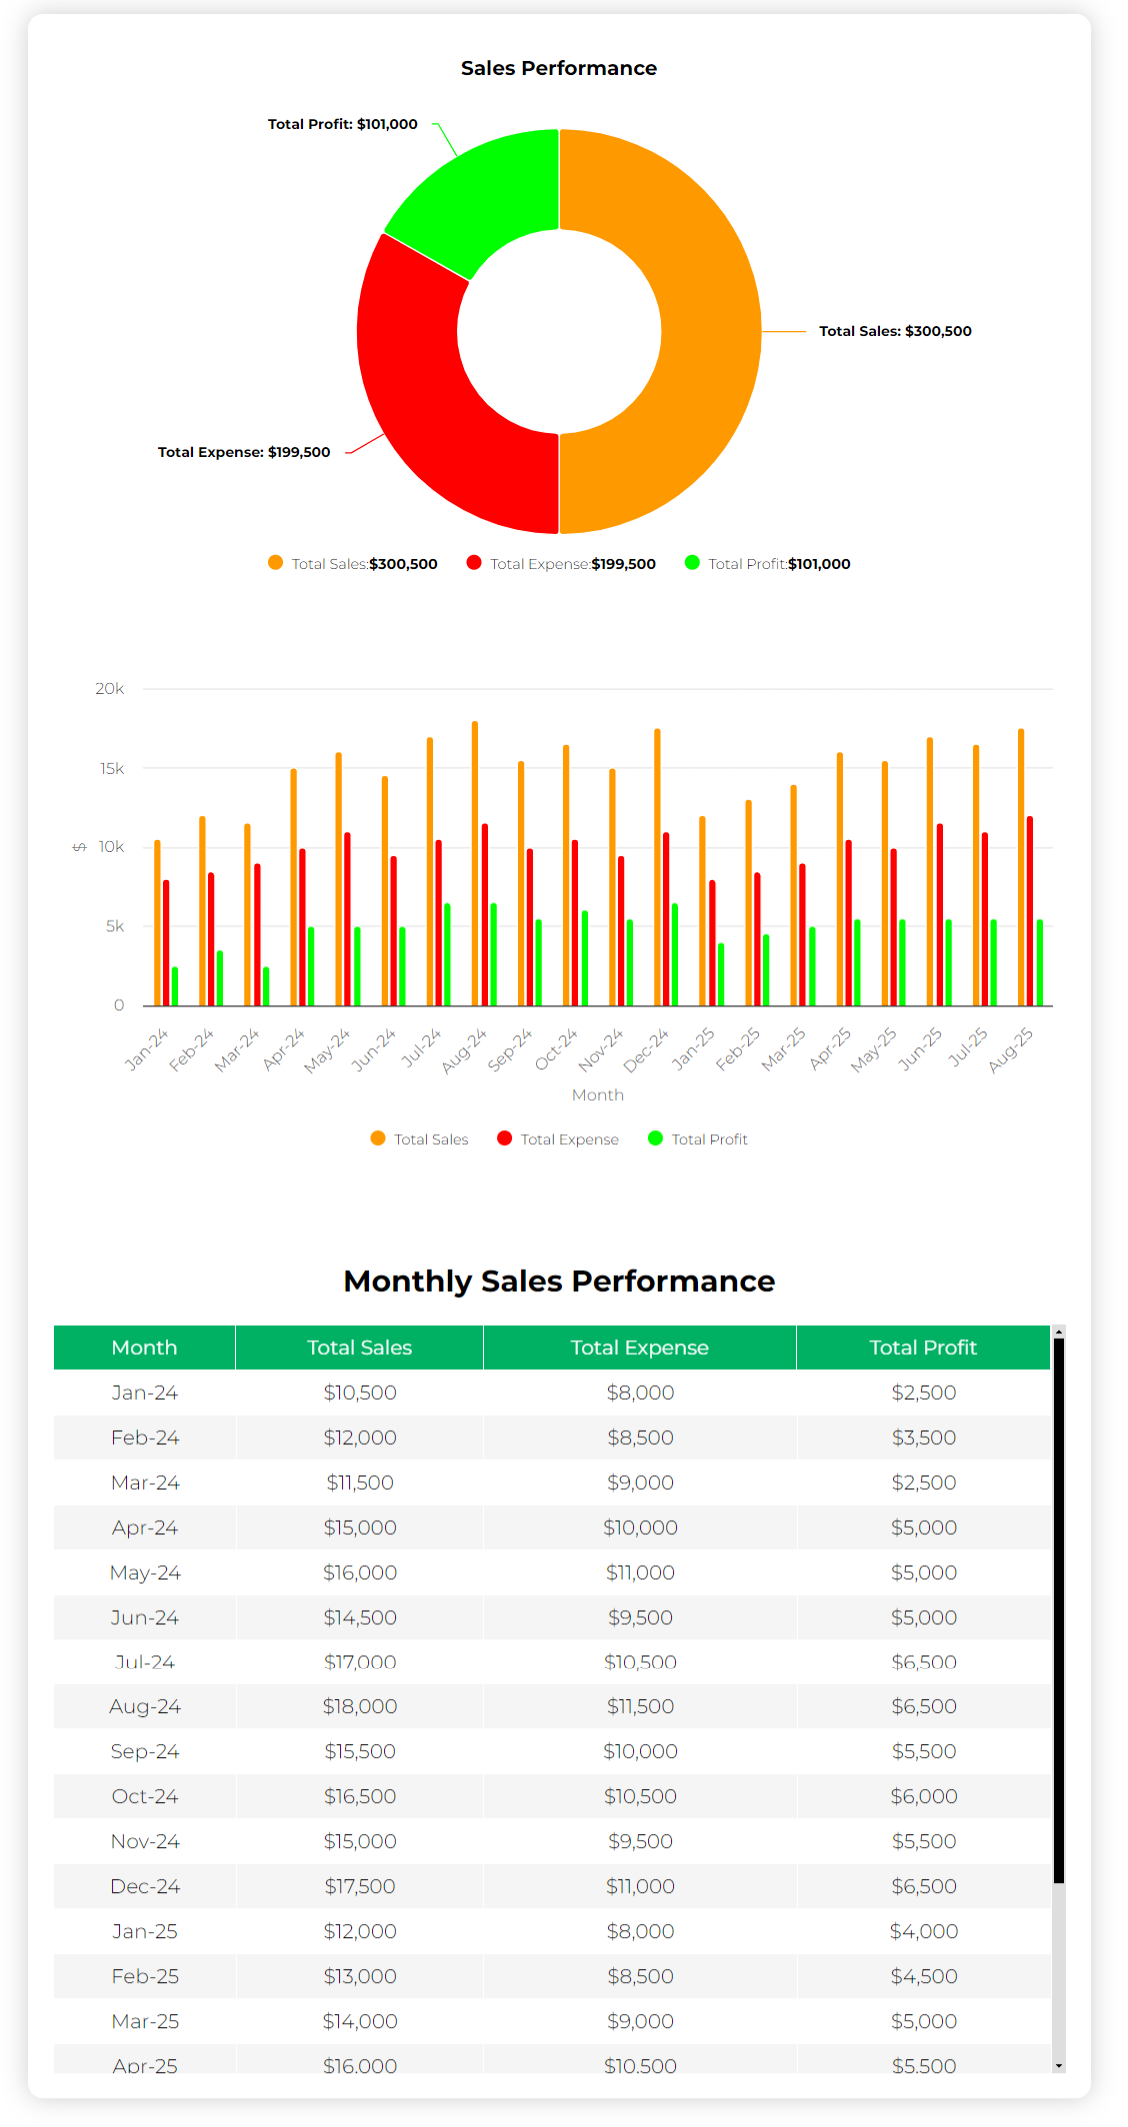
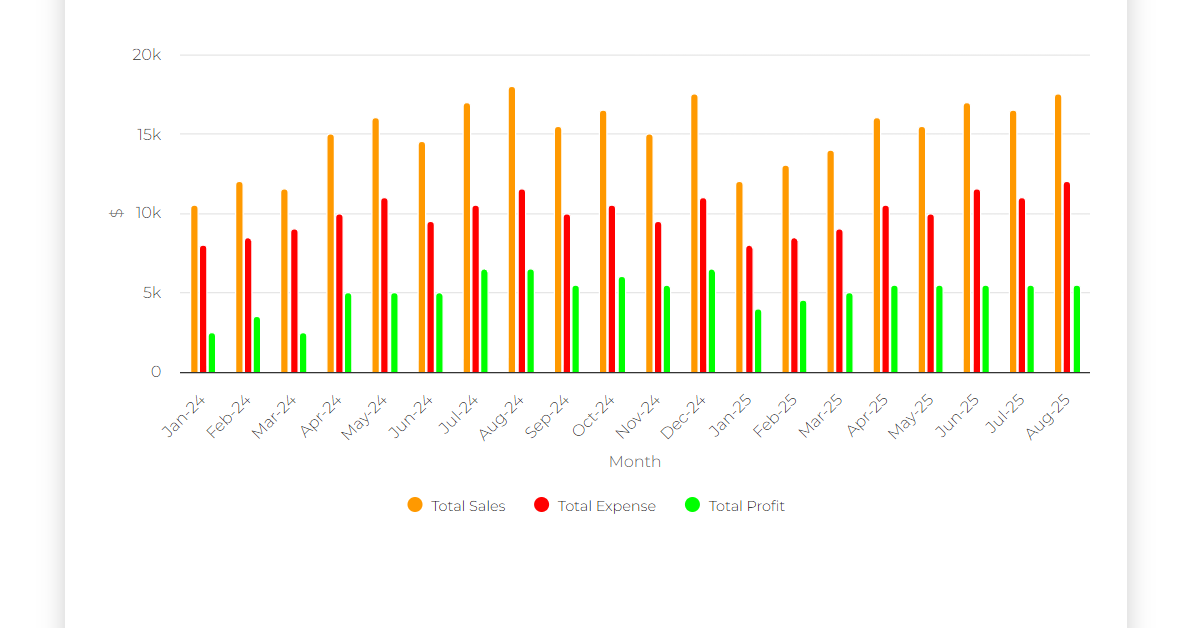
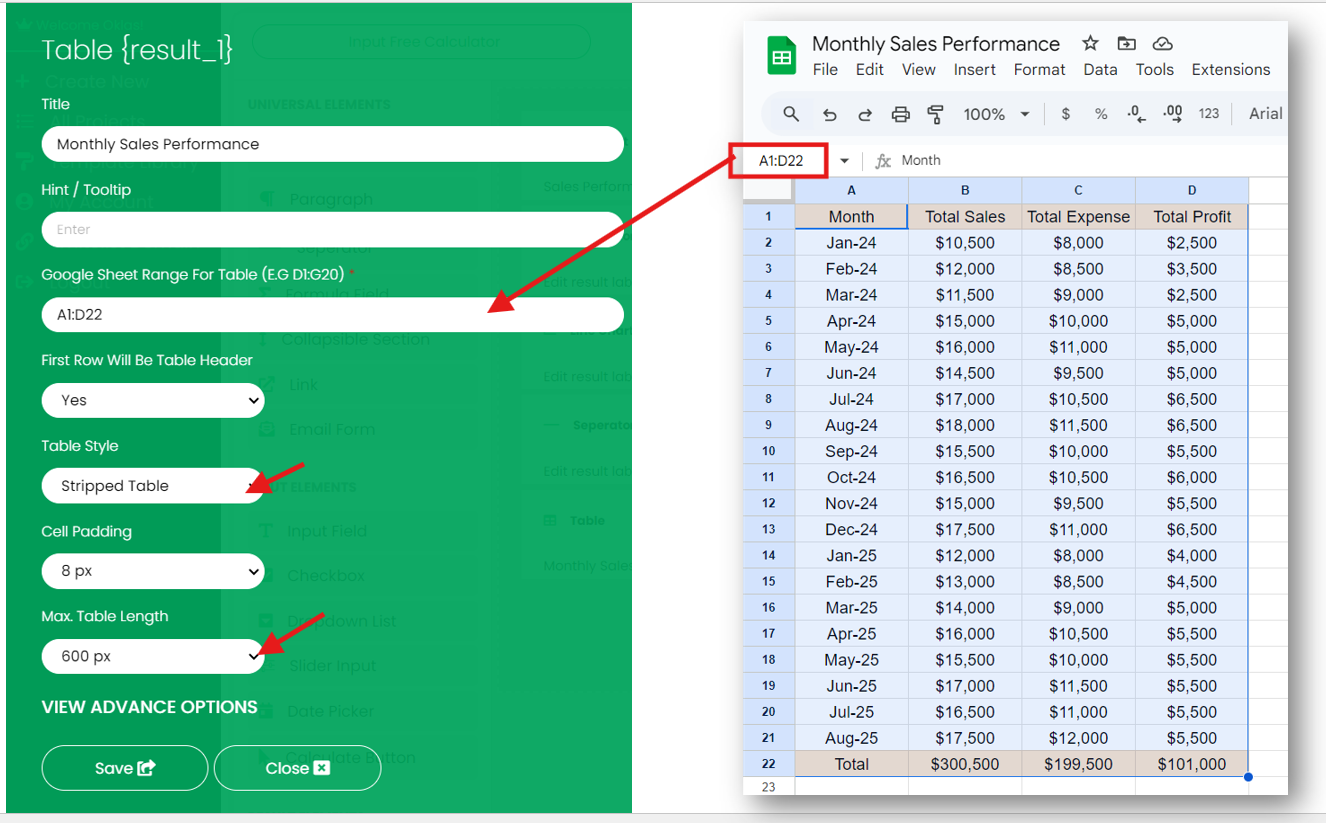
We’ll use a Google Sheet for displaying Monthly Sales Performance as an example to displays data in a table, a donut chart, and a column chart:
https://docs.google.com/spreadsheets/d/18NmgtcsxC1qdn7yyUksfQncltfIGu0n3Y0F_G64HN2k/
The data includes the following:
- Total Sales: Monthly sales data.
- Total Expense: Monthly expense data.
- Total Profit: Monthly profit data.
- Totals: Row 22 in the Google Sheet shows total values for Total Sales, Total Expense, and Total Profit. This row will power the donut chart.
Adding Donut Chart #
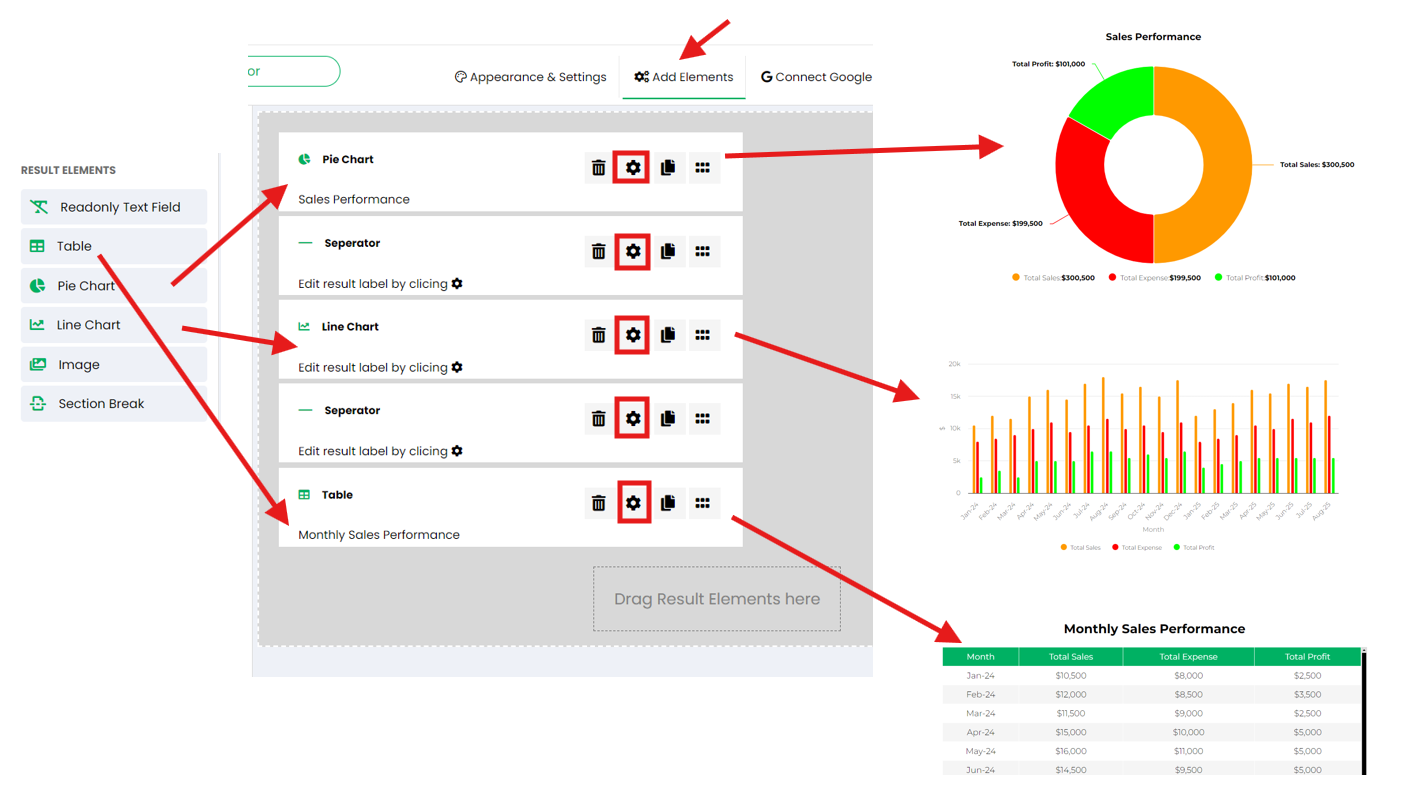
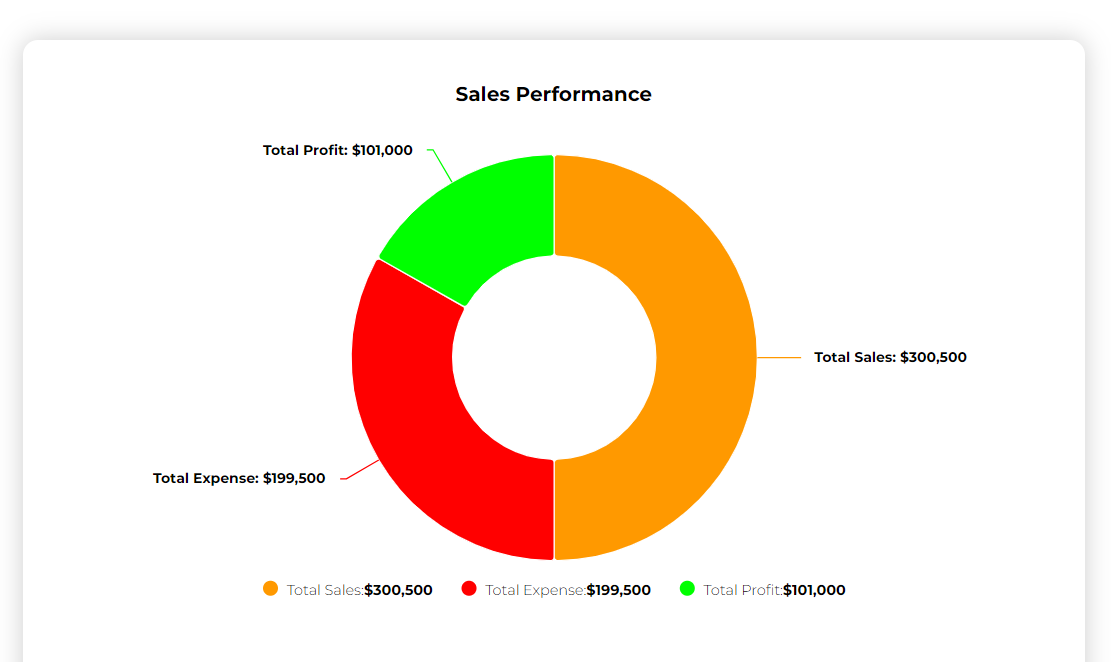
We will add a donut chart for data in the range G3:H5 that displays the total of all months. The configuration is explained in the images below.
In this example, we used specific color codes for the Donut Chart to differentiate between Total Sales, Total Expense, and Total Profit. The color codes used are:To customize the chart with your desired colors, you can obtain color codes using online tools like HTML Color Codes. These tools allow you to select a color visually and provide you with the corresponding hex code, which you can use in your calculator for consistent branding and presentation.
- Total Sales: Orange (#ff9900)
- Total Expense: Red (#ff0000)
- Total Profit: Green (#00ff00)
Adding Column Chart #
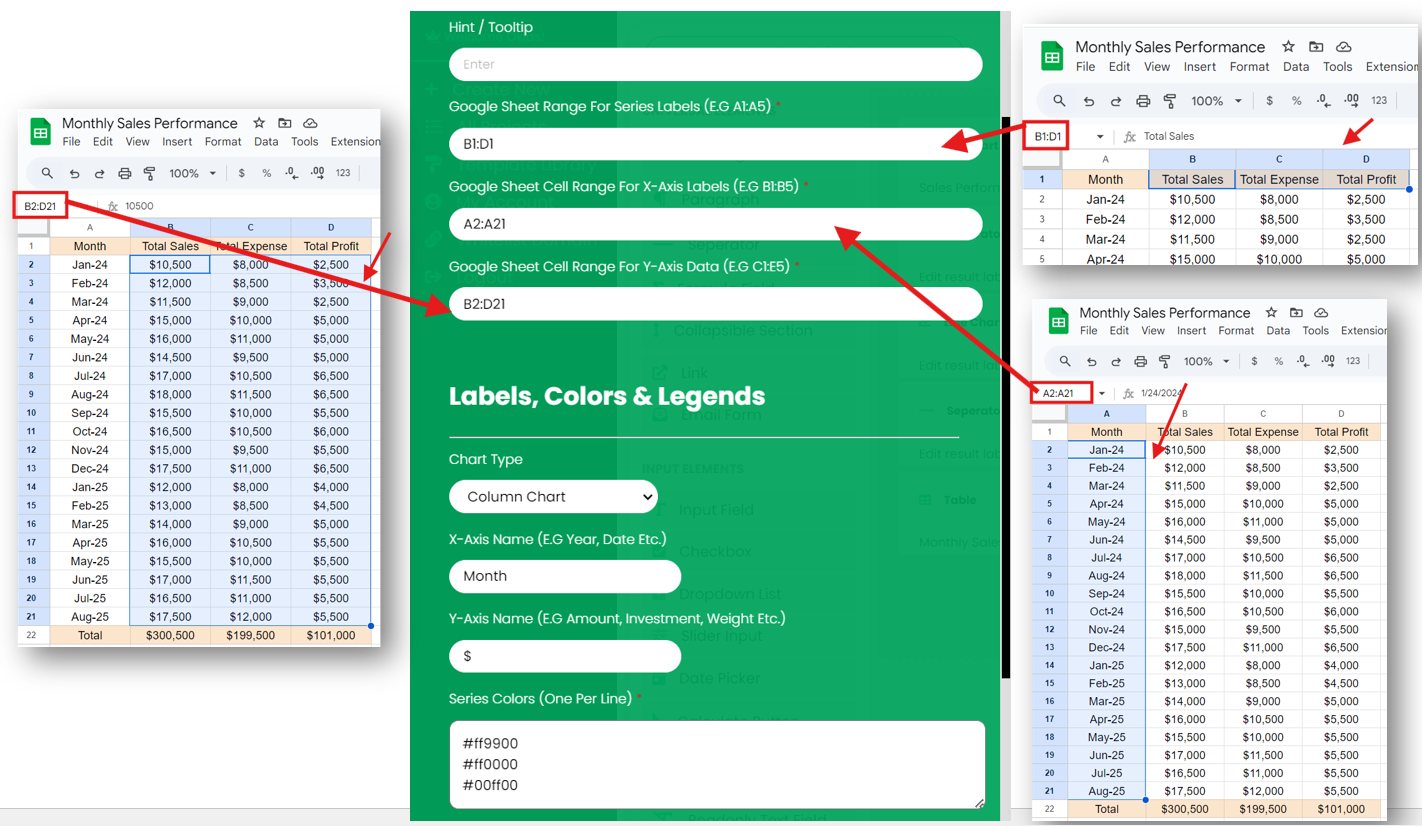
We will add a column chart for data in the range A1:D21 that displays values for each month. The configuration is explained in the images below.
You can use the column stacking option to stack columns in your chart for better data comparison. Additionally, you can switch to a line chart by selecting the desired option from the “Chart Type” dropdown menu.
Adding Table #
We will also add a table for data in the range A1:D21 that displays values for each month in tabular form. The configuration is explained in the images below.
You can enable / disable scrollbar for lengthy tables using “Max. Table Length” dropdown in table configuration.
Step 5: Customize Appearance and Settings #
Go to the Appearance & Settings tab to adjust layout of your calculator like setting width, shadow etc.
For more details on adjusting calculator settings, visit the Appearance and Settings documentation.

